
How I Filled Out My NL Relief Pitcher of the Year Award Ballot
Breaking down the rationale behind my first-ever MLB Award vote, NL Reliever of the Year, and what I valued in filling out my ballot.
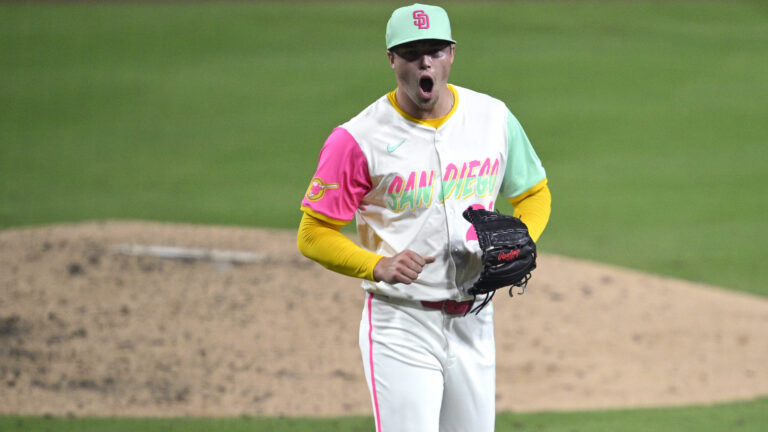
When I started writing about baseball nine years ago in my college dorm room, I never imagined I’d one day be filling out an awards ballot. This year, I got my first crack at it, and fittingly, it came for an award that’s in its first year, too: the National League Relief Pitcher of the Year Award.
With a new award comes a fun challenge: digging into what should matter the most. Naturally, every award brings this conversation to the table. The National League Rookie of the Year Award announcement last week serves as a very in-your-face reminder of that.
But with a new award, there’s no precedent to reference. I’m not able to see how the criteria I value most would’ve lined up historically with voting results, and with relievers, we’re dealing with the shortest resumes of any award.
The good news is, the No. 1 spot was a slam dunk this year with Padres closer Mason Miller putting together one of the better relief seasons we have seen in some time.
But we’re asked to give five names, and the results of spots two through five matter for player earnings, whether it be the pre-arb bonus pool, contract incentives, or arbitration.
Here’s my full ballot:
1. Mason Miller (Padres)
2. Jhoan Duran (Phillies)
3. Adrian Morejon (Padres)
4. Didier Fuentes (Braves)
5. Mason Montgomery (Pirates)
So what matters most when evaluating the relievers not named Mason Miller?
I won’t pretend to have it figured out, but it came down to trying to distill things down to which relievers made the most significant impact on their team through availability and the things they can control.
Spots three through seven were separated by razor-thin margins, and I wouldn’t consider arguing with a ballot that included Trevor Megill or Abner Uribe. Here’s how I tried to break the ties.
Workload
We are already working with minute samples when it comes to relievers, making ERA a high-variance figure that is still relevant, but fails to tell the whole story.
We are already working with roughly a third of the innings compared to the Cy Young Award candidates, so while a 10-inning difference may seem nominal on the surface, it represents roughly 15% of a reliever’s workload, just like a roughly 30-inning sample for starters.
In the case of Morejon, his 2.83 ERA was the highest of the five relievers I cast on my ballot, but his 86 innings were the most of the bunch by 15 1/3 innings. The smallest workload of the five was Jhoan Duran (59 1/3 innings), but his level of dominance in other key metrics that I will get into later pushed him up the ballot.
In addition to sheer volume of innings, the length of appearances a reliever is providing, on average, can be a unique separator as well. This is something that Didier Fuentes excelled at for the Braves, completing two more innings in relief in 13 of his 57 relief appearances while picking up four or more outs on 21 occasions.
Morejon provided length in addition to consistent availability as well, completing two innings in eight of his appearances and picking up four or more outs in nearly a third of his appearances (25 of his 76). His combination of length and availability at such high leverage is why he landed in the No. 3 spot on my ballot, and I still wrestle with the idea of whether he should’ve had the No. 2 spot.
By the workload logic, it would be fair to reference Aaron Ashby as a player who could have cracked the top five, as he led all relievers with 87 innings pitched, but tended to pitch at lower leverage than the other candidates and trailed in key metrics like Win Probability Added (WPA) and K-BB%.
WPA (Win Probability Added)
I didn’t put much stock in saves for this ballot, and WPA is a big reason why. Saves are more of an arbitrary stat that fails to tell the complete story.
A closer can come in with a three-run lead, give up two, and still get the same credit as a guy who strands the bases loaded in a one-run game. Meanwhile, setup men and firemen who are often pitching the biggest innings of the night rarely get a save at all.
WPA gets at what we should care more about: how much a reliever moved the needle on his team winning that night. And nowhere is that more obvious than when a pitcher comes in with runners already on.
Fuentes was more effective in the fireman role, allowing just seven of his 32 inherited runners to score compared to Ashby’s 11 of 24, which is a contributor to the large gap in WPA.
Fuentes finished fifth in the National League WPA department, just behind: Mason Montgomery, Morejon, Abner Uribe, and Miller, respectively.
To put Miller’s dominance in perspective in this department, his 4.56 WPA was 1.07 above the second-place Uribe. This carves out a case for Uribe as well, but there is a large gap between him and the rest of the candidates in K-BB%.
Trevor Megill checked in at 7th in WPA as well, which, as I am writing this, I realize how this piece could come off as Brewers erasure, but a key reason for him coming up just short is how heavily I weighed the next criterion.
K-BB%
Strikeout-minus-walk rate really helps us dial into the skill of the pitcher and how they were able to execute during the season, filtering out the noise that comes with a small sample.
The only two pitchers in MLB with a K-BB% north of 30% on the season were Miller (37.9%) and Duran (31.4%). Mason Montgomery checked in at third in all of baseball at 28.8%.
For Miller, it was his outrageous 47.4% strikeout rate, nearly ten percentage points above Montgomery for the best mark in baseball. That made it easy for him to pace the league in K-BB%, even while walking hitters at a nearly 10% clip.
Duran was as impressive a combination of both big whiff stuff and command as we saw this season, finishing third in strikeout rate with the lowest walk rate among qualified relievers. When it came to the things Duran could control, he was one of the best relievers in baseball.
Even with his 1.82 ERA, there’s a case that Duran was unlucky. A ground ball pitcher with arguably the worst defensive infield in baseball behind him, Duran surrendered a .346 BABIP, second in the National League (min. 40 IP). The only pitcher ahead of him was his teammate, Jose Alvarado, and the three behind him were all Rockies.
These factors made me less concerned with Duran’s 2.36 WPA, the lowest on my ballot. WPA charges a pitcher for every hit that falls, including the ground balls that slipped through a porous infield.
In the race for my final spot, the gap in this area was a key separator: Montgomery’s 28.8% K-BB% was more than ten percentage points better than Uribe’s 18.4%. To put that in perspective, the two are the same distance apart as Uribe is from Miles Mikolas in K-BB%.
From July 1 onward, Montgomery was the best reliever in baseball. In that span, he overtook Miller and led the National League in: K-BB%, WPA, ERA, opponent batting average, and WHIP.
Megill feels like 5-B on my ballot. His 22.3% K-BB% ranked 10th in the National League, neck and neck with Morejon and Fuentes, who separated themselves in the aforementioned department.
No ballot for a first-year award is going to be perfect, and I’ll be curious to see how my thinking holds up as this award builds its own history.
But every pitcher on my ballot either stood out in at least two of the three areas I valued most — staying available, changing the outcome of games, and controlling what they could control — or in Duran’s case, was as dominant as anyone in the league at the things he could control.
Uribe had the results, and Megill was as close as it gets, but each came up just short of that line. It was a thin one.
Become a Member of Just Baseball
Subscribe and upgrade to go ad-free!
* Save 25% by subscribing annually.

Written by
Aram Leighton is the Co-Founder and Executive Editor for Just Baseball. A Syracuse University grad, Aram is one of the hosts of the Just Baseball Show…