Baseball Stats Explained: Advanced Hitting Stats
What's the best way to analyze hitting ability? We've got answers.

This series will aim to provide insight into common(and not-so-common) baseball statistics. We will start with the basics and build up to more advanced concepts. Follow along and don’t be afraid to ask questions in the comments or reach out to me on Twitter!
Weighted Runs Created Plus (wRC+)
wRC+ is the hitting stat that every baseball fan should use for analyzing hitting ability. It is all encompassing of hitting performance. wRC+ or Weighted Runs Created Plus puts a weighted value on each outcome for a hitter as it relates to run creation. wRC+ is scaled, so 100 is average every single season, which allows us to compare across seasons and eras using wRC+. Every point above and below 100 is a percentage point better or worse than league average. wRC+ is park adjusted as well, so the effect of hitting at Coors field or Yankee Stadium is accounted for in the equation. wRC+ takes every piece of a hitters offensive profile into account and for that reason it is my go-to hitting metric. Hitters with high wRC+ tend to walk more, strikeout less, and produce high slugging percentages.
2021 MLB wRC+ Leaders
| Player | wRC+ |
| Vlad Guerrero Jr. | 196 |
| Jesse Winker | 178 |
| Fernando Tatis Jr. | 173 |
| Ronald Acuna Jr | 169 |
| Matt Olson | 168 |
Vlad’s 196 wRC+ is 96% better than league average, which is always 100 wRC+, meaning Vlad is almost twice as good at the plate this season as Paul Goldschmidt.
Weighted On Base Average (wOBA)
wOBA is a variation of On Base Percentage that puts a weighted value on each outcome at the plate. A Double is worth more than a single in terms of projected run scoring, so it is weighted accordingly.
Formula from 2020:
wOBA = (0.699×Walks + 0.728×hit by pitch + 0.883×1B + 1.238×2B + 1.558×3B + 1.979×HR) / (At-bats+ Walks – Intentional walk + Sac Fly + Hit by pitch)
That can be a lot to digest at first, but the important takeaway is that all hits are not created equal. Home runs create more runs than any other outcome at the plate and are counted as such. A home run in the formula is worth about 1.98 runs and a single is worth .883 runs.
wOBA and wRC+ are very similar stats and often produce similar leaderboards, so feel confident in both when doing analysis. I often choose wRC+ because it accounts for park factors and wOBA does not.
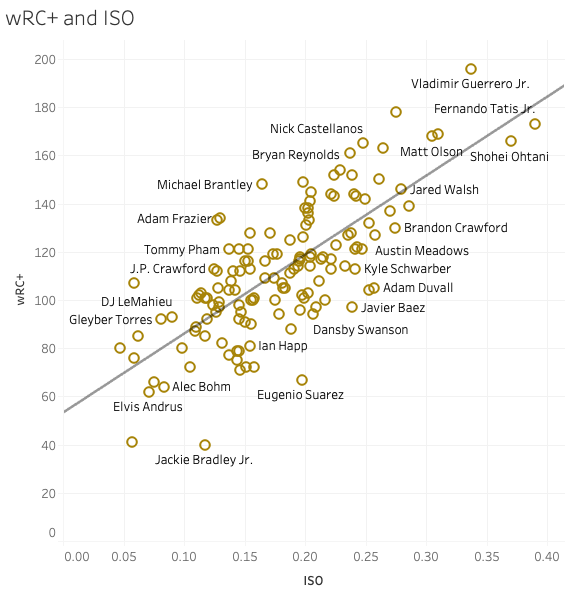
Isolated Power (ISO)
ISO measures raw power and only takes into account extra base hits. It is useful for analyzing raw power production and is one of my favorite stats for analysis.
Formula – ISO = (1x2B + 2x3B + 3xHR) / At-bats OR Slugging percentage – Batting average
Of 61 players in 2021 with more than 200 PA and .200 ISO or greater, only 5 out of 61 players have less than 100 wRC+. Hitting for power AKA a high ISO is a surefire way to produce as an above average hitter in the MLB.
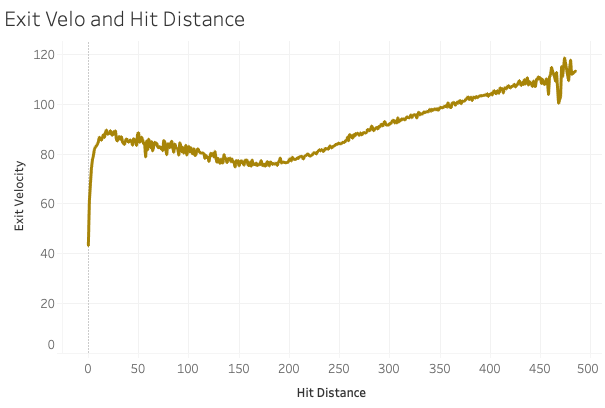
Hard Hit Rate (HH%)
Hard Hit Rate shows percentage of batted balls with exit velocity over 95 MPH. Batted balls over 95 MPH are correlated with higher wOBA and farther batted ball distance. Below are two graphs. One shows the relationship between exit velocity and hit distance and the next shows the relationship between Hit Distance and wOBA. As exit velocity increases, hit distance increases as well and as hit distance increases, so do wOBA values on hits. The main takeaway is that hard hit balls lead to better outcomes at the plate.


Written by
Hi everyone my name is Colby Olson and welcome to Just Baseball! I have been around the game since I was 4 years old and have…