NL MVP Race: An Analytic Break Down
Evaluating the NL MVP race through an analytic lens.
With the season coming to a close, one member of the Baseball Writers Association of America(BBWAA) from each MLB city will place their vote for who they deem the Most Valuable Player from each league. The aim of this article will be to analyze the MVP race from an unbiased point of view, as oddsmakers and talking heads have the power to sway our opinions on a whim.
Total Runs Created
In this article, I will be using a new stat called Total Runs Created and Total Runs Created+ to assist in my analysis. This stat is derived from Weighted Runs Created (wRC) and Defensive Runs Saved (DRS). Much like WAR, it aims to give a complete picture of a player’s offensive and defensive value. Before we look at the results of Total Runs Created (TRC), let’s first go over how it’s created.
Weighted Runs Created is a metric that captures individual offensive value by assigning a run value to every outcome at the plate. As the season goes on, players create runs by compiling hits, walking and stealing bases. It’s the perfect statistic for accurately assessing a player’s value at the plate over an entire season. Listed below are the top five in weighted runs created this season.
| Player | wRC |
| Vladimir Guerrero Jr. | 140 |
| Juan Soto | 136 |
| Bryce Harper | 127 |
| Freddie Freeman | 119 |
| Marcus Semien | 117 |
Weighted Runs Created is a counting stat like runs batted in or home runs, so playing more games allows for more opportunities to create runs. The more common version of wRC is wRC+, which is weighted around 100 being average and every point above or below 100 is percentage better or worse than league average. wRC+ is calculated on a per plate appearance basis, so a smaller sample size does not hurt a hitter like Fernando Tatis, who missed time this season. When analyzing an MVP race, games played gives important context into the full value a player actually provided to their team. Overall, both wRC and wRC+ give optimal insight into complete offensive value.
Defensive Value
Now that we have a stat that determines offensive value, we must factor defensive value into the equation. To do this, we will use Defensive Runs Saved (DRS) which shows how many runs better or worse a player has been compared to the average player at his same position. While defensive metrics are not perfect, DRS is very accurate at crediting good defense and discrediting bad defense. Listed below are the top five and bottom five in DRS this season.
| Player | DRS |
| Michael A. Taylor | 20 |
| Jacob Stallings | 20 |
| Carlos Correa | 20 |
| Harrison Bader | 15 |
| Ke’Bryan Hayes | 15 |
| Player | DRS |
| Jose Iglesias | -22 |
| Zack Collins | -17 |
| Jarred Kelenic | -16 |
| Ketel Marte | -15 |
| Rafael Devers | -13 |
DRS is a great statistic for grading defensive value because the players that visually amaze like Harrison Bader are almost always towards the top of the leaderboard and the players that are visually horrible like Rafael Devers are towards the bottom.
Now that we’ve identified two statistics that encapsulate value from an offensive and defensive perspective in the form of run creation, we can combine them into one statistic that will show total run creation. Since wRC and DRS are on the same scale, I can combine them to get Total Runs Created (TRC). Taking it one step further, league average wRC over 600 plate appearances is 65 wRC, so to gauge which players are above and below league average (zero being average), I subtract 65 from each players’ wRC and then combine it with DRS to get full value above league average. For example, Eric Hosmer, Joey Wendle and Ian Happ are league average in value according to TRC. Finally, I combine wRC+ and DRS to get TRC+, which will also be centered around zero.
| Player | TRC | TRC+ |
| Vlad Guerrero Jr. | 77 | 69 |
| Juan Soto | 72 | 68 |
| Marcus Semien | 62 | 44 |
| Austin Riley | 58 | 47 |
| Bryce Harper | 56 | 66 |
There are some noticeable differences between TRC and TRC+, which can be attributed to players like Marcus Semien and Freddie Freeman accumulating more plate appearances than other players on the list, and thus having higher Total Run Creation over the full season, but less run creation on a per plate appearance basis.
Bryce Harper, Juan Soto or Fernando Tatis Jr.
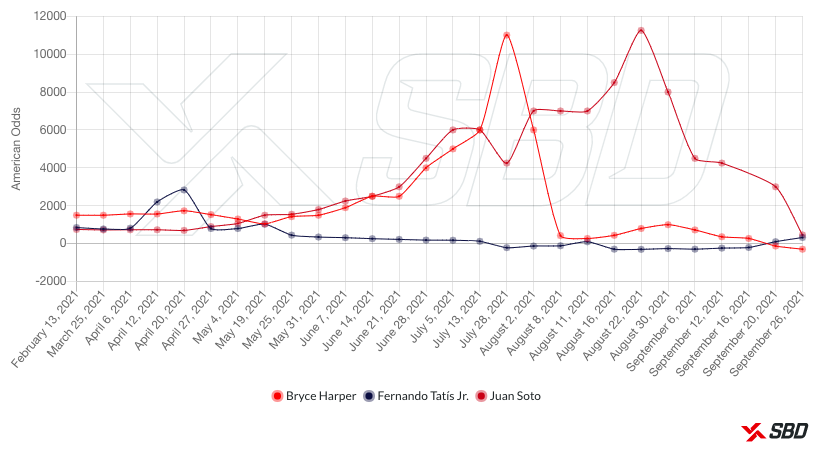
Now comes the fun part! The graphic below from Sports Betting Dime shows the progression of odds to win NL MVP throughout the season. Fernando Tatis Jr. was the clear favorite for almost four months, before being passed by Bryce Harper on September 20th, a mere two weeks before the end of the season. It’s an unprecedented collapse, with Fernando Tatis finding himself potentially third in the race behind Bryce Harper and Juan Soto.
Looking at the total run creation of the three contenders, Juan Soto has the clear lead in Total Runs Created, as he’s only missed 10 games all season, and a slight edge on Harper in Total Runs Created+, showing that when on the field, Harper and Soto have been almost identical. If Harper had not hit the injured list for a short stint in late May, Soto and Harper would likely be close in Total Runs Created as well. As for Tatis, it’s clear why he’s fallen out of the race. While Juan Soto and Bryce Harper have combined for a 207 and 209 wRC+ in the second half, leading baseball, Tatis has settled in at a 146 wRC+, which by all measures is very good, but not good enough to overcome Soto and Harper’s pace.
| Player | TRC | TRC+ | Odds |
| Bryce Harper | 56 | 66 | -300 |
| Juan Soto | 72 | 68 | +460 |
| Fernando Tatis Jr. | 32 | 52 | +325 |
By TRC’s criteria, we’ve seemingly eliminated Fernando Tatis from the conversation; not that he won’t get first and second place votes, but he will likely not win MVP. Now we’re left with a battle between Juan Soto and Bryce Harper. As mentioned above, Soto has a lead in Total Runs Created (the counting stat version), but let’s focus on TRC+, as I don’t believe Soto playing only 11 more games than Harper to be a tide changer. When on the field, Harper and Soto have been nearly identical, each hitting over .300, walking around 20% of the time, and providing 30+ home run power leading to a TRC+ of 66 and 68, which is well above Aaron Judge in fourth place with 56 TRC+.
As for their defense, Harper is below average with -6 defensive runs saved, but Soto is not much better with only two defensive runs saved. In short, neither player has a great impact on the defensive end, and at the end of the day, the value they provide to their team is almost even. Wins Above Replacement has them tied as well, with Soto at 6.6 WAR and Harper at 6.5 WAR. So if Soto and Harper are splitting hairs in value, how do we decide which player is MVP?
To me, the answer is quite simple: The tie in an MVP race goes to the player on a team fighting for a playoff spot. Harper’s performance over the last two months has held the Phillies within reach of the NL East title, while Soto’s Nationals have been out of the race since before the trade deadline. This isn’t to discredit Soto’s performance, but when overall value is so close, the tie goes to the player battling pressure and constant high leverage at bats, something Soto has not had to deal with. I expect Soto to get first place votes, but Bryce Harper is the National League MVP.
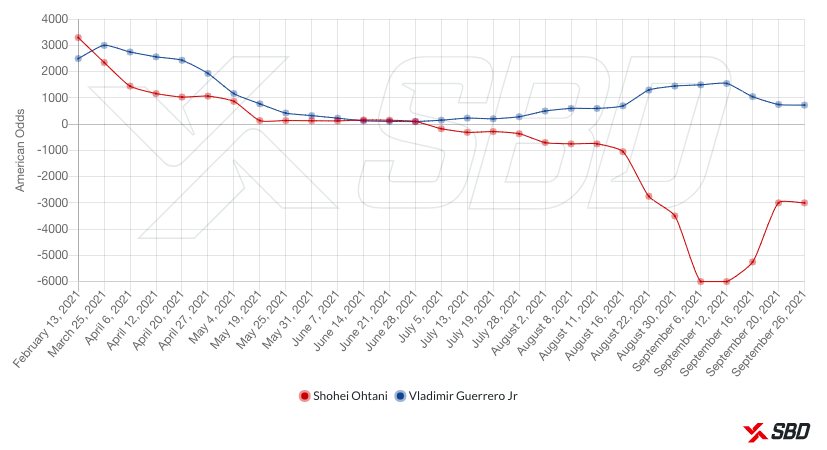
Shohei Show
Moving on from the highly contested Nl MVP race, the AL MVP race has been all but decided, as Shohei Ohtani‘s odds sit at -3000 and Vlad Jr’s at +725. Using implied probability, -3000 odds are equal to a 97% chance of Ohtani winning MVP, and for good reason. While Vlad Guerrero Jr leads baseball in TRC and TRC+, his impact on the field still does not come close to the value Ohtani has provided for the Angels this season.
Ohtani ranks sixth in TRC+ and 11th in TRC, which in its own right is amazing, but he also has pitched at an elite level this season. In 130 innings, Ohtani ranks 21st in ERA, 15th in expected ERA, and 14th in strikeout rate. In comparison, Gerrit Cole has a 3.08 ERA in 175 innings pitched, so Ohtani has been 75% as valuable as Gerrit Cole on the mound while providing the sixth most value by TRC+ this season.
It is quite unfathomable what Ohtani is doing, especially in a league driven by specialization. We’re not in the 1930’s, where pitchers didn’t need to throw 100 MPH with nasty offspeed pitches to get batters out. Ohtani is not only succeeding, but dominating at the plate and on the mound against the best talent baseball has ever seen. In any other year, Vlad Jr. would likely win MVP, but even a Triple Crown victory this season would not be enough to dethrone Ohtani as the most valuable player in all of baseball.
Top Five MVP Finishers
Finally, let’s predict who the top five vote getters in each league will be based off of Total Runs Created. While winning MVP is the most prestigious of awards, finishing in the top five can have a major impact on Hall of Fame resume and with some future Hall of Famers in the each race, it’s important to know who is strengthening their case for the Hall.
Projected Top AL MVP Results
| Player | TRC | TRC+ |
| 1. Shohei Ohtani | 50 | 53 |
| 2. Vladimir Guerrero Jr. | 77 | 69 |
| 3. Aaron Judge | 53 | 56 |
| 4. Marcus Semien | 62 | 44 |
| 5. Carlos Correa | 53 | 52 |
| 6. Jose Ramirez | 48 | 49 |
| 7. Matt Olson | 54 | 53 |
| 8. Cedric Mullins | 50 | 42 |
Since 2017, only three players, have accumulated more Wins Above Replacement than Aaron Judge, and once again, he has shown why he is one of the most valuable players in baseball, ranking fourth in TRC+. Judge should be the clear third vote getter ahead of Marcus Semien, who is likely to have his second top five MVP finish in the last three years.
While Semien only ranks 15th in TRC+, meaning he is not as valuable as others on a per plate appearance basis, there is something to be said for Semien not missing a single game this season, while providing elite defense and a strong bat out of the leadoff spot. Voters love players that stay on the field.
The fifth spot is a bit more complicated with Carlos Correa, Jose Ramirez, Matt Olson and Cedric Mullins all slated to receive votes. Carlos Correa has been a force this season and is slated to break records as he enters free agency this winter. There has not been a better defender in baseball this season than Carlos Correa, as he has collected 20 defensive runs saved at the hardest position in baseball. Mixing that with a 133 wRC+ makes Correa the fifth most valuable player in baseball, and arguably more valuable than Semien.
Jose Ramirez is clearly the best third basemen in baseball, making exceptional plays at a premier position, while ranking 11th in baseball in wRC+, so he comes in at the number six spot. Mullins(42 TRC+) and Olson(53 TRC+) round out the top 8.
Projected NL MVP Results
| Player | TRC | TRC+ |
| 1. Bryce Harper | 56 | 66 |
| 2. Juan Soto | 72 | 68 |
| 3. Fernando Tatis Jr. | 32 | 52 |
| 4. Corbin Burnes | N/A | N/A |
| 5. Austin Riley | 58 | 47 |
| 6. Paul Goldschmidt | 56 | 46 |
| 7. Max Muncy | 41 | 46 |
| 8. Tyler O’Neill | 34 | 50 |
Coming in at number four in MVP voting is Corbin Burnes, who does not qualify in Total Runs Created because he’s a pitcher, but he really has been that good! Burnes has a 2.29 ERA, which is now the best in baseball in after Max Scherzer‘s rough start on Wednesday. He also leads baseball in every predictive statistic like xERA, FIP and xFIP, so it’s usually safe to say when Burnes is on the mound, he’s the most valuable player on the field.
Austin Riley rounds out the top five, ranking fourth in baseball in TRC and 12th in TRC+. The Braves third baseman has drastically improved his defense in his second full MLB season, going from -10 DRS in 2020 to 11 DRS in 2021. This change has allowed Riley to enter the conversation as a top 10 offensive player in baseball.
Two veteran first basemen, Max Muncy and Paul Goldschmidt come in at 6th and 7th, providing unreal offensive impact and top tier defense at first base. Although first is not a premier defensive position, the duo have combined for 15 defensive runs saved this season.
Tyler O’Neill rounds out the top eight. Although O’Neill has been limited to only 521 plate appearances this season, when he’s been on the field he’s been a superstar. He ranks 10th in TRC+, making him a candidate to finish in the top five if he stays healthy next season. Freddie Freeman also just missed the cut as he’s been incredible at the plate once again and has not missed a game all year.

Written by
Hi everyone my name is Colby Olson and welcome to Just Baseball! I have been around the game since I was 4 years old and have…