Why Spencer Torkelson’s Hard Contact Isn’t Translating to Power
Detroit's former first overall pick has shown the ability to hit the ball hard in the majors, but it has yet to result in real success.

The Detroit Tigers selected Spencer Torkelson first overall in 2020, making the can’t miss college bat a top prospect in their system. After a quick stint in the minors, Tokelson was brought to Detroit, making the Opening Day roster in 2022. So far, it has not gone as planned.
After a rough start to his Major League career, Torkelson was sent back to Triple-A before once again returning to Detroit. Although he had pedestrian numbers, many thought 2023 would be a big breakout year for the 23-year-old. Well, it’s mid-June and it has yet to happen.
As of June 11th, Torkelson is slashing .225/.309/.352 with five home runs in 61 games. Production that does not match a first overall pick. You might point towards the expected stats and batted ball data to show improvement is expected.
| Torkelson | AVG. | xBA | SLG | xSLG | Avg. Exit Velocity | Barrel% | Hard Hit % | Launch Angle | FB% |
| 2023 | .255 | .259 | .352 | .424 | 91.9 mph | 9.4% | 49.7% | 15.6 | 43.3% |
A quick glance at Torkelson’s Baseball Savant page will lead you to believe he’s having a great season. The bubbles are mostly red, which in the most elementary explanation, is usually good. He’s impacting the baseball and not just hitting hard grounders.
Torkelson has 86 batted balls over 95 mph, which is roughly the same amount as Austin Riley, Jose Ramirez, Matt Olson, Josh Jung and Mike Trout.
However, the production has been drastically different. And before you say it, it is not just a ballpark issue. Torkelson’s expected home runs are roughly the same, maybe one or two more, in any ballpark besides Milwaukee, where he would have nine.
| Player | Avg. Exit Velocity | Launch Angle (Degrees) | HR |
| Torkelson | 91.9 mph | 15 | 5 |
| Riley | 92.7 mph | 12.8 | 11 |
| Olson | 92.7 mph | 16.1 | 17 |
| Jung | 91.9 mph | 15 | 13 |
| Trout | 92.4 mph | 18.8 | 14 |
| Ramirez | 89.2 mph | 20.9 | 10 |
On the surface, it does not make much sense. So, what is going on?
Lifting the Ball
Launch angle and barreling baseballs continue to be a prime discussion in the baseball world. Although it might sound overblown at times, it really does make a difference in how successful you can be. Each degree in launch angle matters more than you would think.
If we take Torkelson’s max exit velocity of 112, and combine it with his 15 degree average launch angle you are looking at a 2.2% home run probability. How about 112 mph and a 16? That changes to a 10.3 home run percentage. A major difference.
Hitting a home run with a launch angle of 15 degrees or less is nearly impossible, unless you are hitting the ball over 115 mph. Of Torkelson’s 86 balls over 95 mph, 49 have a launch angle of 15 degrees or less. Nineteen were between 16 degrees and 25 degrees. Five were 25 degrees to 35 degress.
Of his top 10 hardest hit balls, two are over 15 degrees, a home run and a double.
Ok, take a breath. That’s a lot of numbers and degrees for a non-weather paragraph. Let’s watch some video.
This video shows the 10 hardest hit balls of the year from Torkelson. Although several result in a hit, it paints the picture of why his power numbers are not matching up with more home runs and extra base hits. He’s not lifting the ball enough to make the hard contact turn into game changing results. Line drives and singles are great, don’t get me wrong. But you don’t draft a player 1:1 to hit singles.
Of course extra base hits can come from balls that are not in his top 10 exit velocities. But you need the launch angle, which he struggles to find, combined with power.
The barrel rate is good, and those balls are resulting in doubles more often than home runs, which is to be expected. Barrel rate does not translate to home runs the way you might expect it to. Players with similar barrel rates as Torkelson include Fernando Tatis, Jarred Kelenic, Ramon Laureano, Nick Maton, and Michael Massey. Truly a mixed bag.
Unlucky?
If you glance at Torkelson’s stats the expected stats (“x” stats) will show a completely different player. He currently has a .259 xBA, .424 xSLG, and .334 xwOBA. That’s vastly different than his .225 average, .352 slugging percentage, and .293 wOBA.
I get it, people are frustrated with expected stats. Who cares what is expected, what actually happened is all that really matters, right? Yes, but understanding what is more likely to happen might help tell the story of what could happen the next time similar contact is made.

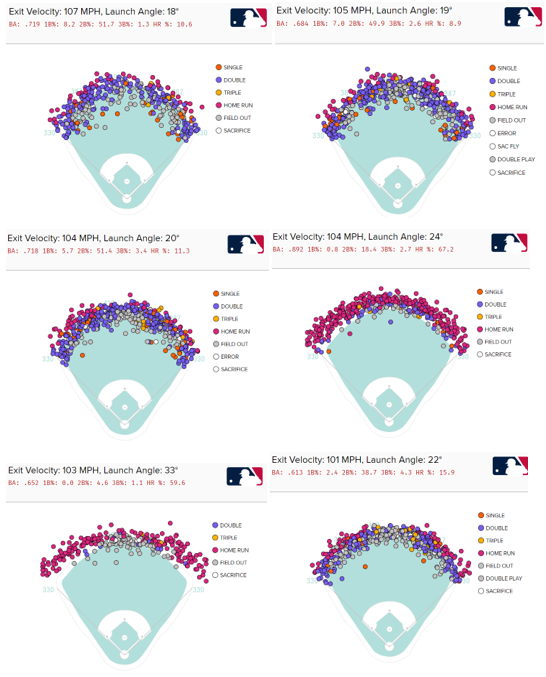
These charts show the six hardest hit balls with a launch angle over 18 that resulted in outs for Torkelson. Each a flyout with an expected batting average over .600 and expected home run rates relatively high. Obviously, these particular outs fell into the “unlucky” category. In reality, that’s just how percentages work. Sometimes you are on the wrong side of it.
I would say Torkelson has been a bit unlucky, but after watching all of his hard hit flyouts from this year, most seemed pretty routine. The numbers might tell you otherwise, but these three are the only one’s that stood out to me as a defender taking away potentially extra bases.
Keep in mind, we are talking about power and extra bases, so I focused on outs with a higher launch angle only. Maybe some groundball doubles sneaked past me.
How long can you say a player is just unlucky? Although I agree it is part of the big picture, just maybe not the biggest part. On to the final aspect:
Topspin on the Baseball
Now we are really about to get really funky and talk about spin on a baseball. When lifting a baseball, you want backspin which will allow the ball to carry more. Topspin tends to drive a ball down at a much faster rate. Two balled balls with the same exit velocity and launch angle can end up at very different location because of this.
Some say this example was from the ball used in 2022, some would say it’s the difference between topspin and backspin. Either way, you get what I am trying to show you.
We do not have the ball data teams have access to, so keep in mind this is all speculation. At the same time, think how many times Torkelson’s balls just keep carrying. Few come to mind. Savant does have batted ball data called “topped %” which Torkelson sits at 25.7%. For refence, 25% is within a few percentage points as Trout, Olson, Jung, Ramirez and the group listed earlier.
To say Torkelson hits too many balls with topspin would be irresponsible without data to back it up. While I cannot prove it, watch for it going forward and see what you think. Another possibility in this strange puzzle.
Conclusion
First off, it is far too early to call Torkelson a bust. Is he reaching the heights we all expected in year two? No. He’s is showing signs of a better player, and has flashed the ability to impact the baseball. Every player does not develop at the same rate, and he’s simply too talented to give up on after less than 600 at bats.
In order to tap into more power he needs to turn in more 19-30 degree launch angles. He’s hitting the ball hard enough, but not getting enough lift. Doing so more consistently should help turn doubles into home runs. We have already seen an increase in his barrel rate and hard hit rate from last season, and he needs to continue to keep focusing on hitting pitches he can drive.
Playing in Comerica will not do him many favors and he’ll just have to learn to make do. I see him as a Tiger for the foreseeable future, with plenty of productive years still to come.

