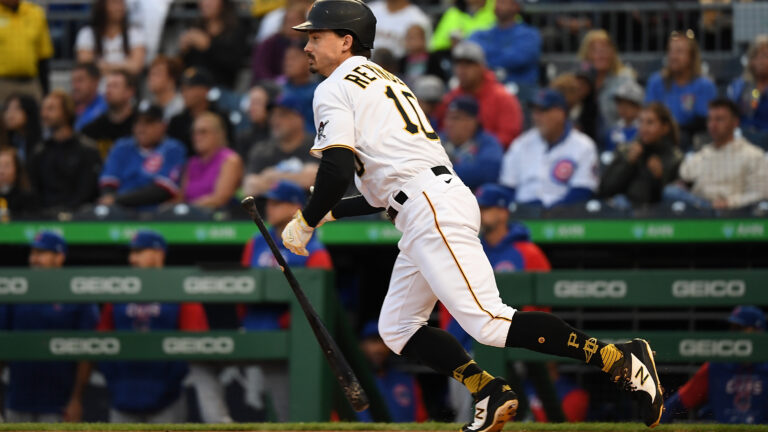
What Happened to Bryan Reynolds in 2022?
Long one of the top names available on the trade block, teams may be concerned looking at Bryan Reynolds regression from 2021 to 2022.
Written By: Cameron Levy
Bryan Reynolds had an exceptional 2021 season. A season that cemented his status as a coveted trade target for numerous contending teams.
A center fielder who posts a 141 wRC+ – and still looks like a center fielder out there – is an extremely valuable player. With four years of control left, Reynolds was set to be traded for a huge package as the Pirates continued to sell assets.
Well, Reynolds wasn’t traded, and he turned in a 2022 season that was….good. His 125 wRC+ is still very solid, but the -7 Outs Above Average made him look like a right fielder playing out of position. Despite the rumors of a Reynolds trade dying down as Spring Training approaches, his time in Pittsburgh has an expiration date. What are teams potentially trading for in Bryan Reynolds?
Is his 2.9 fWAR season from 2022 a better indication of his skill than his 6.1 fWAR 2021?
There are reasons to believe both, and the following analysis will parse through the weeds to determine the answer.
A Change in Pitcher Approach
At the forefront of Reynolds’ exemplary 2021 offensive campaign was his strikeout and walk rates. Those numbers ranked in the 70th and 83rd percentile, respectively, and helped propel him to a K/BB ratio better than that of veteran savvy batsmen like Justin Turner and Michael Brantley.
Those numbers dropped in 2022, with much more pedestrian 40th and 63rd percentile rankings, respectively.
What was behind the decline from Reynolds, and will we see his strikeout and walk rates rebound?
Looking at his performance against fastballs is the first step, seeing as it’s the pitch that he saw most last season by a healthy margin. Here’s a table displaying his performance against 4-seam fastballs the last two seasons.
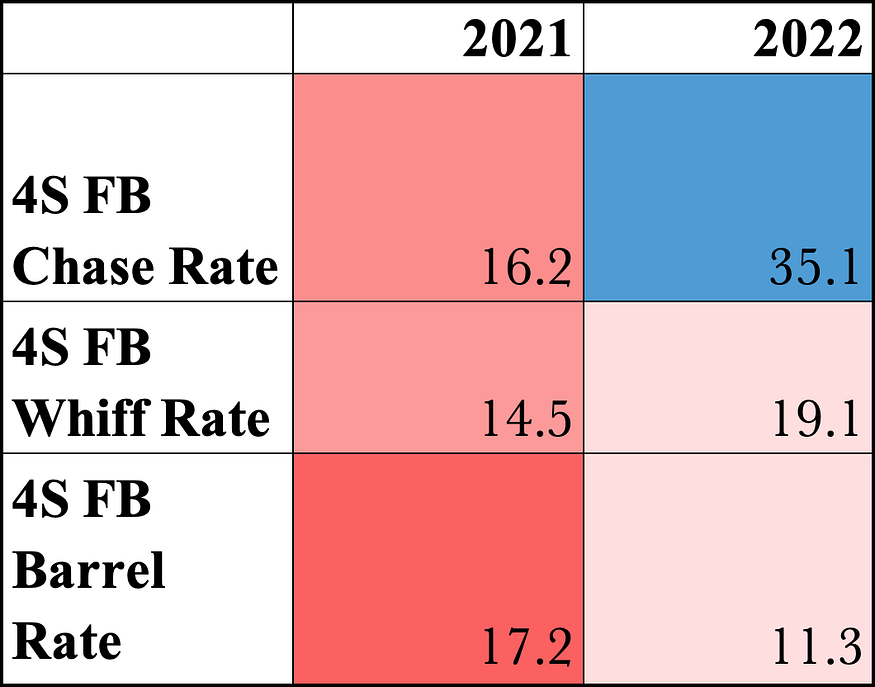
Reynolds performed well against fastballs in 2022, but it pales in comparison to his production against such pitches in 2021. Given the volume of fastballs he saw in 2022, that gap between solid and elite made a huge impact on his overall numbers.
The graphic’s most jarring indictment on Reynolds is that chase rate jump, going from the 84th percentile in 2021 down to the 6th percentile in 2022. That 18.8 percentage point decline in his fastball chase rate was the biggest in baseball by a healthy margin.
Consider how right-handed pitchers located their fastballs against Reynolds. His 2021 fastball heat map is on the top, 2022 on the bottom.


In 2021, Reynolds ranked in the 32nd percentile in the percentage of four-seamers he saw up in the zone. In other words, he saw lots of low fastballs. This was good news for Reynolds, because he has a 6% whiff rate on such pitches since 2021.
In 2022, however, the book seemed to be out on Reynolds. That 32nd percentile figure jumped to the 78th percentile in 2022. This was the right call by opposing pitchers, because Reynolds has a 24% whiff rate on such pitches. No surprise here. Low four-seam fastballs are more hittable than high ones.
(Now, it’s important to note that pitchers did risk serving up hard contact to Reynolds if the pitch was still in the strike zone, as he hit 11 home runs on elevated fastballs – sinkers included – that were in the zone. Still, I’m comfortable saying it was a worthwhile risk for pitchers looking to induce a chase or whiff. Elevated pitches inherently induce higher launch angles, and higher launch angles mean home runs. It’s the risk that any pitcher runs when he throws such pitches.)
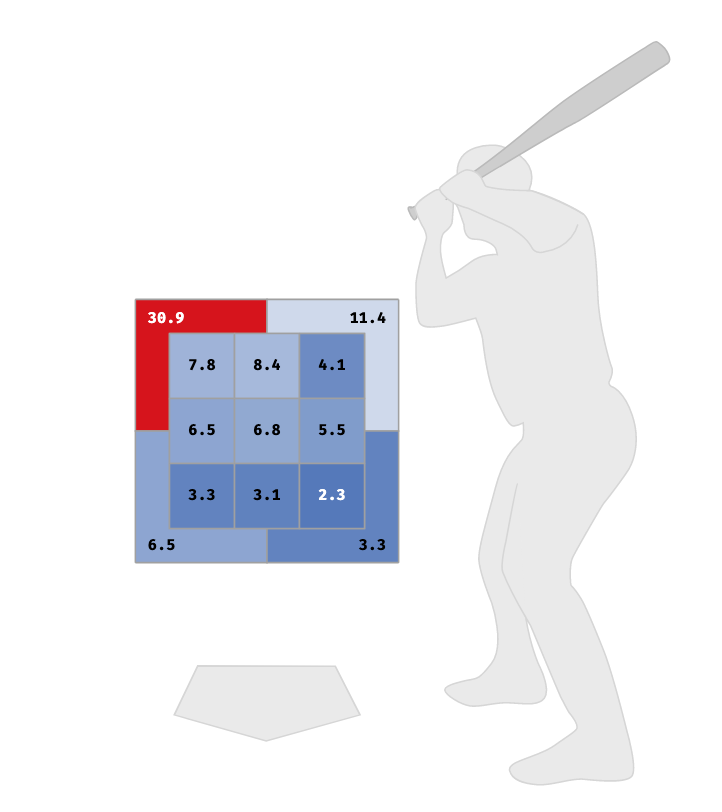
The whiff rate increase between seasons almost surely has to do with the way pitchers located their fastballs. Reynolds’ in-zone fastball whiff rate was actually better in 2022, indicating there was a connection between his chases and whiffs. As shown below in this pitch% image, right-handed pitchers were peppering that up-and-out area with the fastball to Reynolds, which is where the whiffs (41% whiff rate!) were had. That red 30.9% figure was at 18.4% in 2021.
What about that horrendous chase rate? A logical response to the theory that Reynolds’ chase rate jumped due to elevated, out-of-zone fastball location would argue that such rise in chase rate shouldn’t necessarily correlate to the decrease of in-zone fastballs he saw (56% vs 48%).
Just because you see more fastballs out of the zone, doesn’t mean you’re expected to swing at them more! My guess, though, is based on the psychological adjustment a hitter makes when he sees more fastballs outside the zone.
Reynolds knows he has success off of fastballs, and wants to do damage on them whenever they are thrown. Pitchers counteracted this tendency by throwing (elevated) fastballs that are more difficult to hit. In response, Reynolds (probably) thought “arghh, elevated heat? Oh well, guess I have to swing at those, because I loooove fastballs.”
Laying off high heat will be crucial to Reynolds’ game going forward, as it seems to be the bolded/all caps part of opposing pitchers’ scouting reports. Reynolds was by no means a poor fastball hitter last season, but the differences in the color coded table from earlier helps explain where those elite strikeout & walk rates went. Swings, and whiffs, on these types of arm-side running fastballs were far too common for Reynolds in 2022. Note the frustration in the video below.
Lastly, I think the drop in barrel rate can be explained using hints from the already completed analyses. Remember that out-of-zone, up-and-away, bright red area from earlier where right-handers threw 31% of their fastballs to Reynolds in 2022?
Against right-handers in 2021, Reynolds did not hit a single ball in play on fastballs in that area. Not one of the fastballs that Reynolds put in play in 2021 came from that area, meaning he was putting fastballs in play that were in the zone, and therefore easier to barrel.
In 2022, 10.5% of the fastballs he put in play were from this area! Accordingly, not one of those batted balls were barreled.
Reynolds Benefitted From Weaker Competition
There’s one more thing I want to point out, and this is specifically regarding Reynolds as a trade candidate. I don’t love using Baseball Prospectus’ DRC+ metric, mainly because it’s not super easy to understand how all the inputs are weighted.
However, it is the one hitting metric that accounts for quality of opponent. Reynolds capitalized on the pitching he faced the last two seasons. DRC+ painted a more gentle image of Reynolds’ skill, giving him a 126 and 122 DRC+ in 2021 and ’22, respectively.
Again, I’m not super up-to-date on how DRC+ is formulated, but his muted number almost surely has to do with the weaker pitching in the NL Central. Consider this: only 22% of the 4-seamers Reynolds saw last year were faster than 95 mph. That ranked 194th of 200 qualified hitters.
For context, only two of the top 30 hitters in this particular query played in the NL Central, so this isn’t just a Reynolds thing. This is a worrisome trend given the prospect of a trade for Reynolds. He dealt (although not very well) with higher fastballs this past season, but he’s yet to face elite velocity at a sample large enough to indicate he can adjust accordingly. A trade to the Yankees, for example, would exacerbate these holes in his swing. Elevated gas is the benchmark in the AL East.
Defense was…Different
Alongside the offensive downturn, Reynolds became a bad centerfielder in 2022. Or did he?
Outs Above Average and Defensive Runs Saved would indicate so, going from a +10 to a -7 OAA, and a -5 to a -14 DRS. DRS was clearly never fond of Reynolds, but both metrics can agree on some serious regression in 2022. Using catch probability buckets, we can get a better sense of where exactly Reynolds floundered relative to 2021.
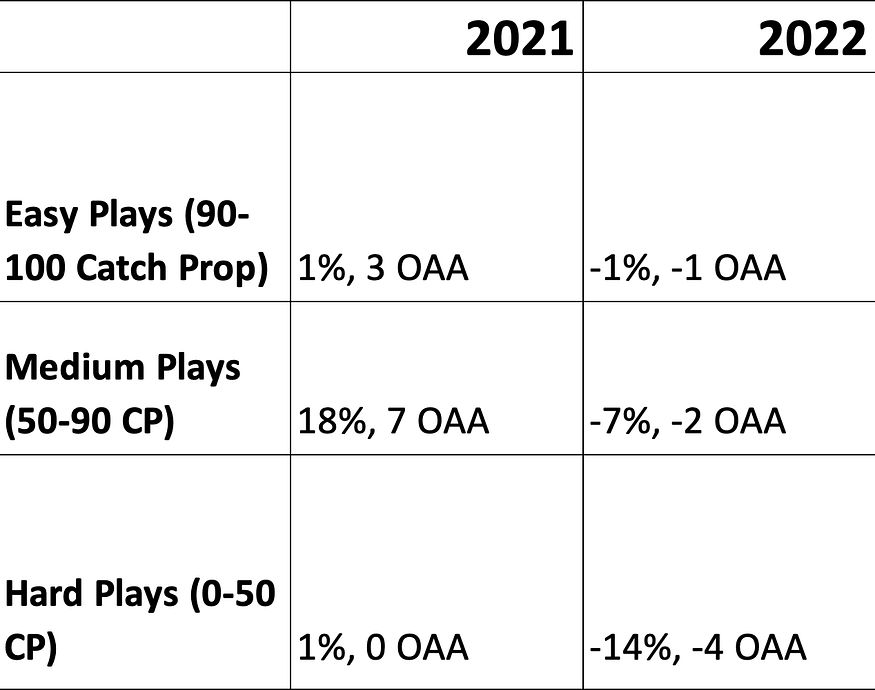
Those percentages are catch probability added, or how much a player over/underperformed his expected catch probability. It’s clear that Reynolds really struggled on those “medium” plays.
A +18% catch probability added is special stuff, while -7% is not. I’ll focus on that portion of the chart, given that it’s where Reynolds saw the biggest drop-off in pure OAA, and it’s where players make up a bulk of their defensive value. The best way to do this sort of defensive analysis is to look at the tape, and go play-by-play.
Reynolds flat out dropped three balls this year that had catch probabilities above 70%. This was a mistimed jump vs the Mets.
This one looks like the fear of a collision got into his head. And despite this being just a bad drop, he got to a ball that Statcast thinks only happens 70% of the time. Drops are more likely to be flukes than not, and I don’t think it’s responsible investigating if you factor those drops into a fielder’s defensive projection for the following year.
In a similar vein, docking a player for losing a ball in the sun is fair for evaluating what happened, but should be taken with a grain of salt in future projection. These five plays linked from above account for ~4 outs above average, and I think it’s best not to chalk these miscues up to Reynolds’ true talent level out in center-field.
On the other hand, Reynolds had some consistently poor jumps on balls this season. Statcast calculates “Jump” by finding how many feet a player covered in the first 0 to 1.5 seconds after a ball is hit. Reynolds went from a 0.9 feet below average jump to 1.5 feet below average.
A good jump is obviously a massive element of catching a ball, and there were multiple (I counted 4) balls that Reynolds didn’t get to where it looked like a late jump was the culprit. Speed is a massive component to a good jump and overall defensive success in the outfield, and Reynolds lost some speed in 2022.
Reynolds’ saw his home-to-first time decline by .06 seconds in 2022, while his sprint speed went from 28.7 to 28.3 feet/second in 2022. These aren’t massive changes, but center fielders need to be fast!
His sprint speed ranked in the 63rd percentile for center fielders in 2021, compared to the 39th percentile in 2022. It’s a significant difference. It’s possible that his oblique injury played a role. Reynolds’ himself said he had been feeling discomfort on his side for “a couple series” when he went on the IL on July 11. It’s unclear where, and why, the speed went downwards.
In sum, I’m not too concerned with Bryan Reynolds’ defense. His poor jumps are partially explained by the decline in speed, but it seems like he can be an average center fielder if he converts the easy plays. On offense, I think he is closer to the 125 wRC+ we saw in 2022 than the 141 wRC+ in 2021.
Reynolds is young enough, though, where adjustments can be made. In fact, this analysis is really just a guess at what happened in 2022. It shouldn’t be taken as gospel, by any means. The lack of competition does scare me, however, and teams should be aware of the level of hitter Reynolds is – and isn’t – before they trade for him.
If you miss your spot on Reynolds, his beautiful swing can cause some serious carnage and teams would still be hard-pressed to find a more talented player with control available on the market.

Written by
Ryan Finkelstein has led editorial for Just Baseball since 2021 and officially became the Editor-in-Chief in 2025. He also hosts Locked On Mets, the No. 1…